This 25 infographic explores Twitter ’s growth and over the past four years


Add to FacebookAdd to DiggAdd to Del.icio.usAdd to StumbleuponAdd to RedditAdd to BlinklistAdd to TwitterAdd to TechnoratiAdd to Yahoo BuzzAdd to Newsvine
Some facts and Statistics:
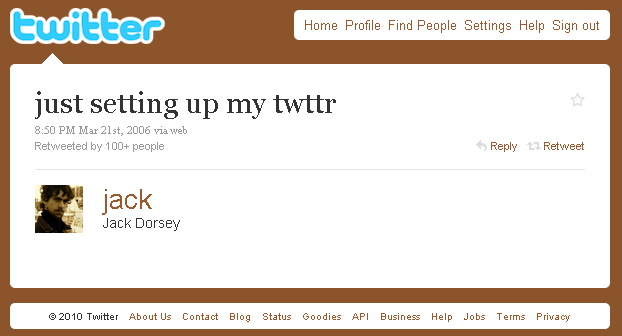
  • Jack Dorsey, one of Twitter’s co-founders, sent the first “tweet” on March 21, 2006.

“First Twitter – jack Dorsey”

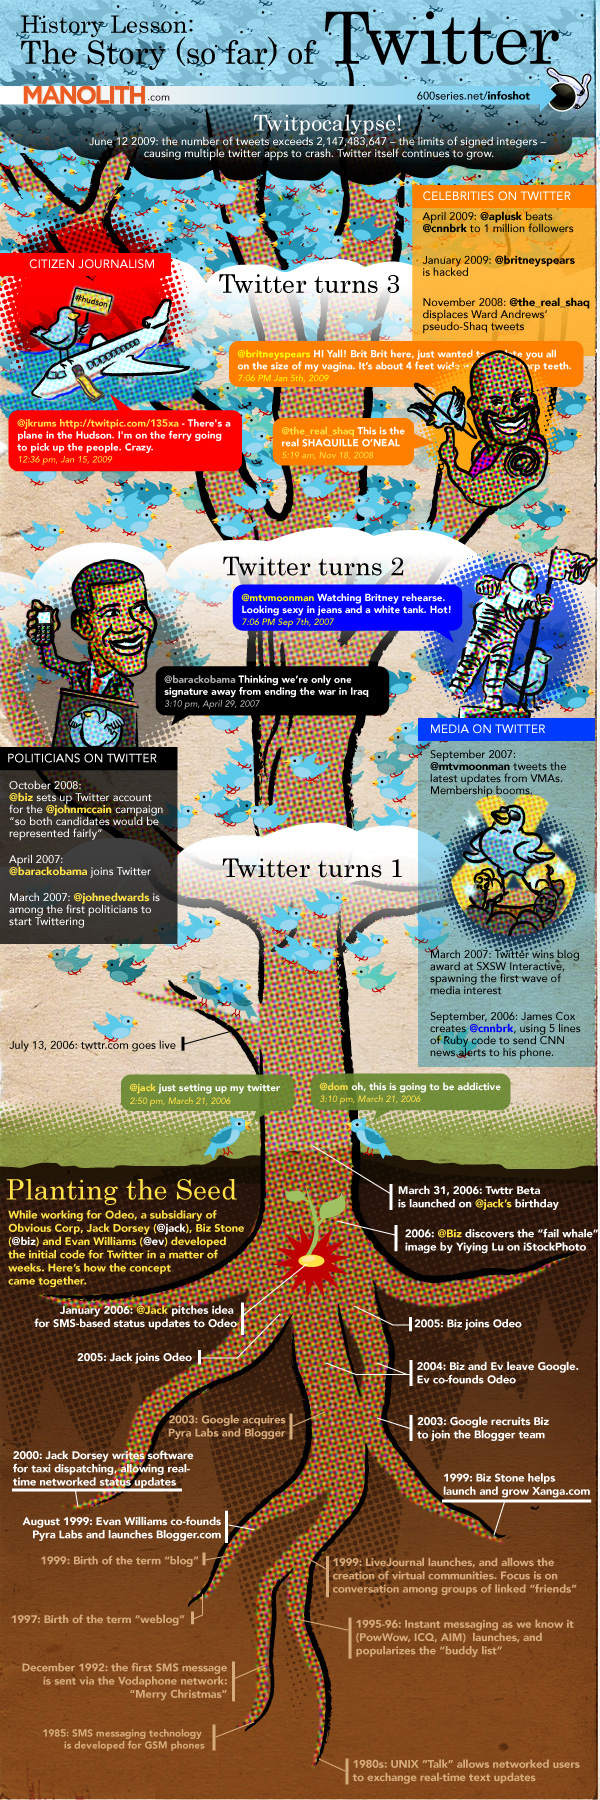
  • The messaging system was originally only used for internal communications at the podcasting company Odeo. It launched for public use in July 2006.
  • In April 2007, the CEO of Obvious, Jack Dorsey, announced that Twitter would be graduating to Twitter, Inc.
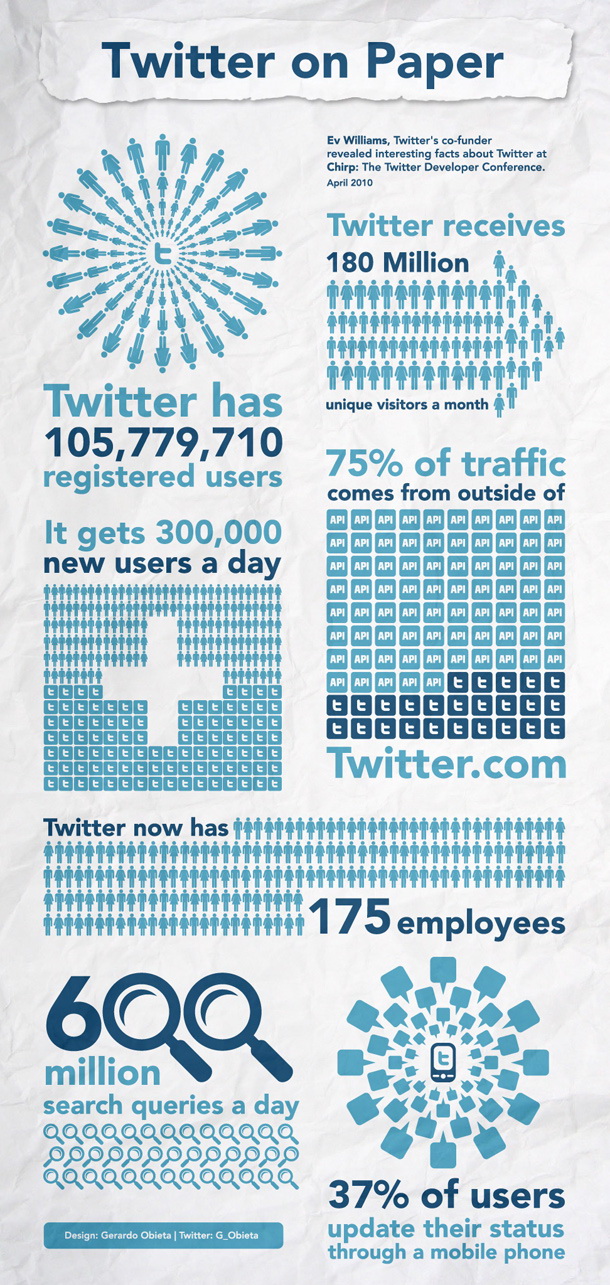
  • Twitter now (April 2010) has 105 779 710 registered users
  • It’s adding 300,000 users per day
  • It gets 180 million unique visitors
  • 3 000 000 000 Requests a day
  • 75% of Twitter traffic is outside Twitter.com
  • 5% of Twitter uses are responsible for 75% of all activity
  • 21% of users have never posted a Tweet
  • 85.3% of all Twitter users post less than one update/day
  • Twitter’s users are doing 55 million tweets per day
  • From 11am to 3pm sees the most activity on Twitter
  • Tuesday is the most popular day for Twitter activity (15.7%).
  • 65% of Twitter users are aged under 25
  • Twitter has 175 employees, up from 40 or so last year
  • 37% of active users use Twitter on their phone
  • 100,000 registered applications
  • Over 50% of users do not use Twitter to tweet, view or manage their account
  • And its search engine gets 600 million queries every day

This 25 infographic explores Twitter ’s
growth and over the past four years

1 – Infografic – Twitter-Statistics-Facts-Figures – April 2010

2- Infografic Twitters recent History

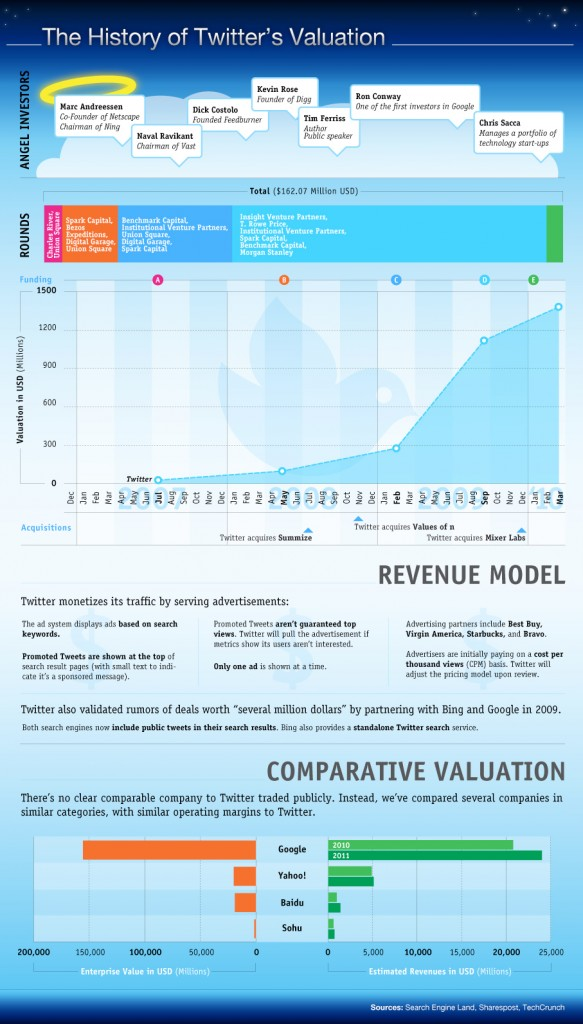
3 – Infographic The History of Twitter’s Valuation

4 – Infographic Twitter History

5- Infografic-Twitter on Paper April 2010

6- Infografic-Profile of a Twitter User

7- Infografic – Twitter Trends

8- Infografic – Empresas No Twitter

9- Infografic  -Why do we follow companies on Twitter

10- Infografic – Republica do Twitter

11 – Infographic Average 100 Tweets

12- Infografic – The 6 Reasons People Tell Me They wont join Twitter

13- Infografic – Why you cant ignore Twitter – Jan2010

14 – Infographic  – Why is Twitter Exploding Because it’s A Conversation Ecosystem

15 – Infographic Most Re Tweetable Days Times

16- Infographic The Journey of a Tweet

17-Infographic  Anatomy of a Tweet

18 -Twitter-Top-15-Infographic

19- Infographic A Visual Guide to Twitter

20- Infografic Le Twitter Hack

21- Infographic – A Strategic approach to using twitter

22- Infographic Facebook vs Twitter

23-Infografic – Blogs user vs Twitter user

24 – Infografic – Twitterverse by jesse and briand solis

25- Infografic – Twitter Worldcup 2010
26- Internet IPOs
infographic-internetipo-where-are-they-now

Sources:
1- Twitter Facts & Figures (history & statistics)-April 2010-Data Compile by Website-Monitoring.com
2- Infographic: The Meteoric Rise Of Twitter – Infografic Twitters recent History
3- The History of Twitter’s Valuation [Infographic]
4- The Story (so far) of Twitter By Sean Percival – Infographic Twitter History
5- Twitter on Paper – Infografic- Twitter on Paper April 2010
6- Typologie en 6 catégories des utilisateurs de Twitter : Profile Of A Twitter User by @ngonews via www.ngonlinenews.com – Infografic-Profile Of A Twitter User by @ngonews via & loichay  [http://bit.ly/caiw40 ]
7- Infografic – Twitter Trends
8- Twitter for Business by By Maksim Ovsyannikov on July 13, 2010 – Infografic – Why you cant ignore Twitter – Jan2010
9- Infographic: Why do you follow companies on Twitter? Posted on September 2, 2010 – by Wayne Sutton
10- República do Twitter Revista Super Interessante By @aversignassi – 9- Infografic – Republica do Twitter
11-More Truth About Twitter – Infographic Average 100 Tweets – [SOURCES: SYSOMOS: INSIDE TWITTER, SYSOMOS: TWITTER’S MOST ACTIVE USERS, PEAR ANALYTICS TWITTER STUDY]
12-6 Motivos que as pessoas usam para não entrar no Twitter
13-Twitter for Business by Maksim Ovsyannikov – Infografic – Why you cant ignore Twitter – Jan2010
14-Why is Twitter Exploding? Because it’s A Conversation Ecosystem by David Armano
15 The Science of Retweets on Twitter – Infographic Most Re Tweetable Days Times
16-The journey of a tweet by Timon Singh – Infographic The Journey of a Tweet
17-The Anatomy of a Tweet by matt buchanan – Infographic  Anatomy of a Tweet
18-Twitter-Top-15-Infographic
19-An Illustrated Guide To Using Twitter –  Infographic A Visual Guide to Twitter
20-Timeline: Le Twitter Hack – Infografic Le Twitter Hack
21-Twitter PR Strategy – A strategic approach for organizations which are using Twitter to connect with their audiences, developed by Ogilvy’s 360 Degree Digital Influence group – Infographic – A Strategic approach to using twitter
22-Twitter vs. Facebook: Quem Vale Mais? bY THIAGO ZENI – Infographic Facebook vs Twitter
23-Blogs, Twittr and Old-School Media  – Infografic – Blogs user vs Twitter user
24-The Twitterverse v0.9 by @BrianSolis & @Jess3
25-2010 World Cup: Twitter Timeline Infografic – Twitter Worldcup 2010
The journey of a tweet by Timon Singh
Twitter Sattistics – Finally! New Stats for 2010
Chirp, Twitter’s First Developer Conference, Opens Its Doors
26-
Internet IPOs ( Cortesy Radel Artida | Staff.com 07.01.2014)

About João Geraldes

Doutorado em Gestão, Estratégia e Posicionamento pela Universidad da Extremadura de Badajoz na área de Organização e Competitividade, Mestre em Gestão no Instituto Superior de Gestão e Licenciado em Organização e Gestão de Empresas no ISCTE. Atualmente é Coordenador da Licenciatura de Gestão do Instituto Piaget, Docente na Licenciatura de Gestão no ISCTE, Diretor Emérito do Instituto Superior de Ciências da Administração, Vice Presidente da Assembleia Geral - Associação Europeia de Saúde Educativa e Preventiva em Epigenética, Vice Presidente da Data Science Portugues Association, Presidente da Assembleia Geral da Associação Portuguesa dos Profissionais de Vendas, Presidente da Direção da Associação de Proprietários de São Marcos desde 1995, CEO da 2B-On | AGÊNCIA DE MARKETING DIGITAL. Leciona ainda na Ordem dos Farmacêuticos a Pós-Graduação de Marketing Digital e é docente também no Centro de Estudos Superiores da Indústria Farmacêutica em Marketing Digital, acumulando experiência lectiva desde 1990. É membro efetivo da Ordem dos Economistas com o nº 10723.
This entry was posted in Social Media (Uk) and tagged , , , , , , , , , , , , , , , , , , , , , , , , , , , , , , , , , , , . Bookmark the permalink.

4 Responses to This 25 infographic explores Twitter ’s growth and over the past four years

  1. Pingback: Inc On Twitter | AllGraphicsOnline.com

  2. Pingback: Twitter History | AllGraphicsOnline.com

  3. Pingback: Examples of Research « Rebecca Noonan – Media Project 5

  4. Olivier says:

    Amazing collection of Twitter stats. Love it!

Leave a comment